Scottish Orange Maps
Fig.1
Fig. 2 Distribution of Scottish Orange Lodges, 2001
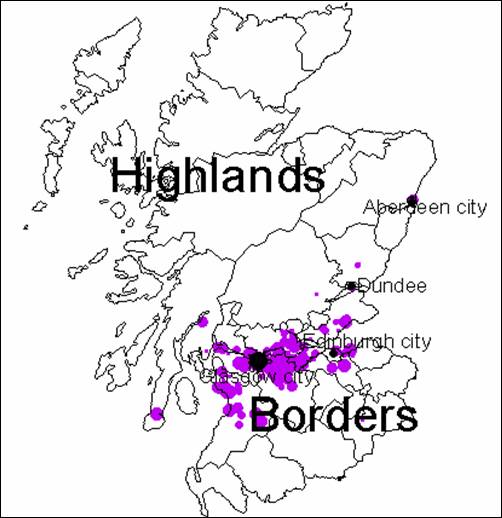
Fig. 3 Distribution of Orange Lodges, Central Scotland, 2001
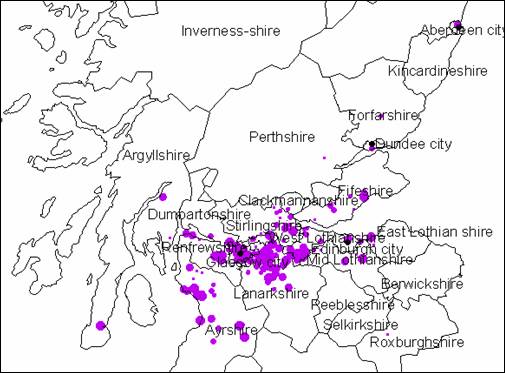
Fig. 4 Orange Density per Adult Male Protestant Population, Scotland, 2001 (click to enlarge, and hold cursor to zoom in)
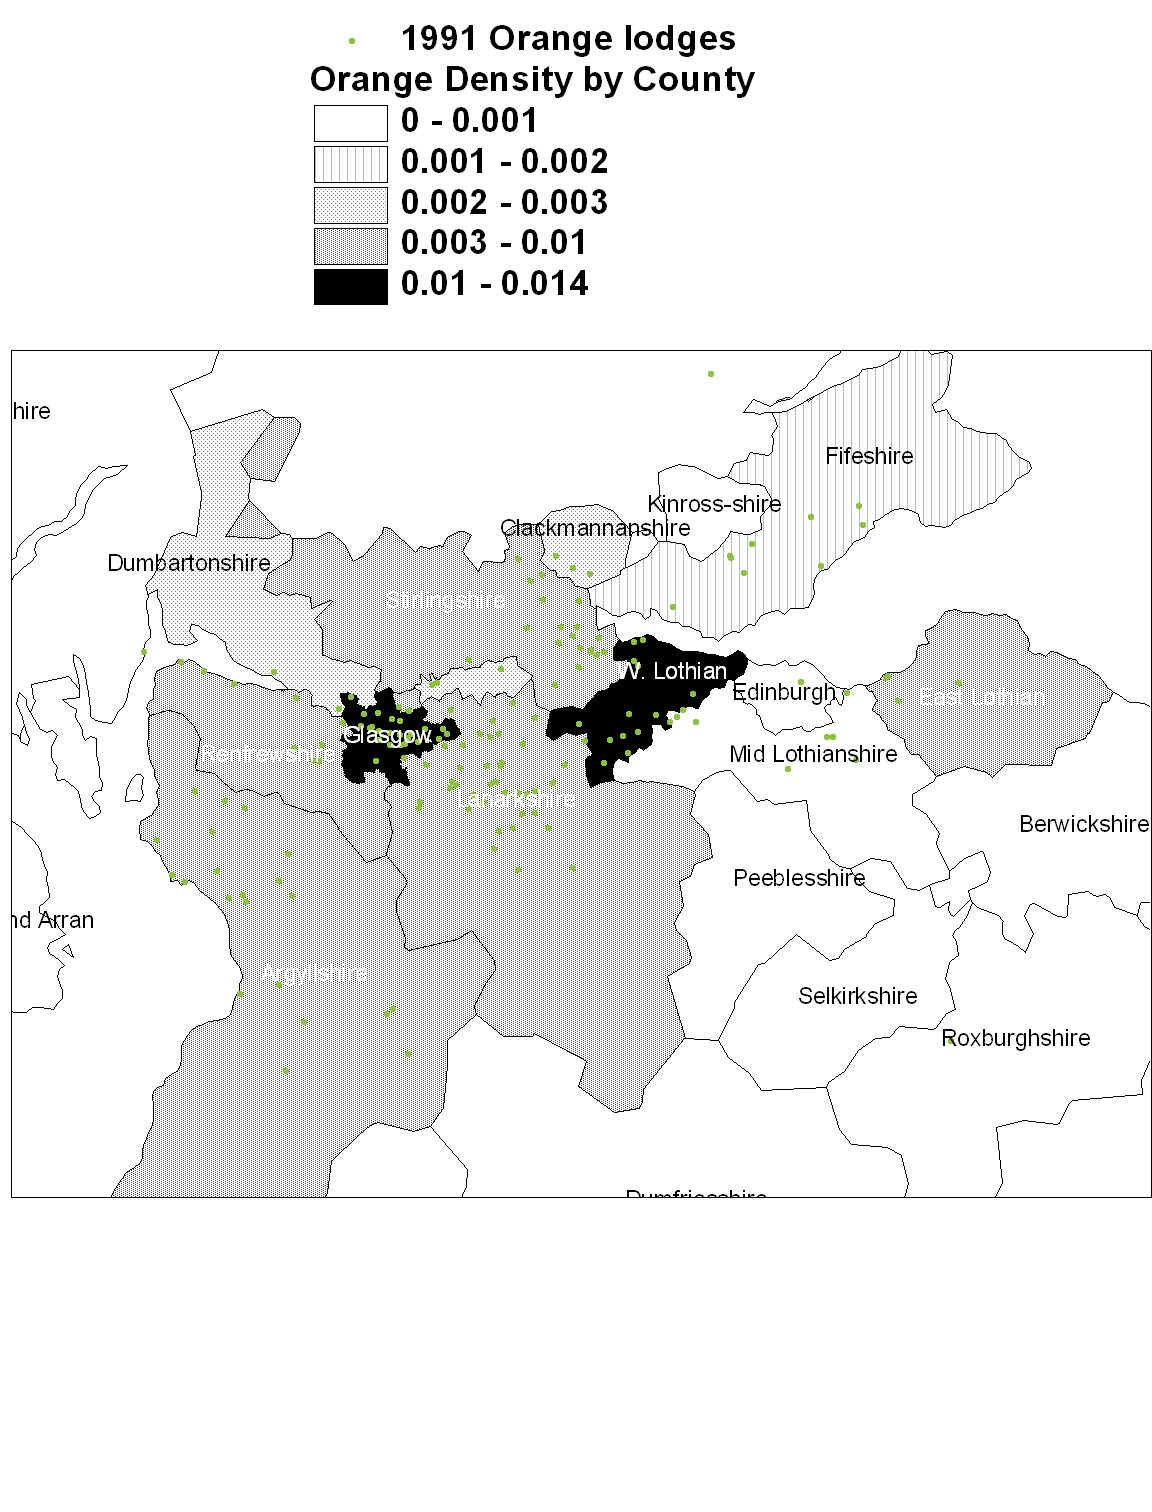
Fig.5
Membership by County, 1861-2001
Fig. 6 Orange Lodges in Glasgow, 1981, inflated by size (click to enlarge, and hold cursor to zoom in)
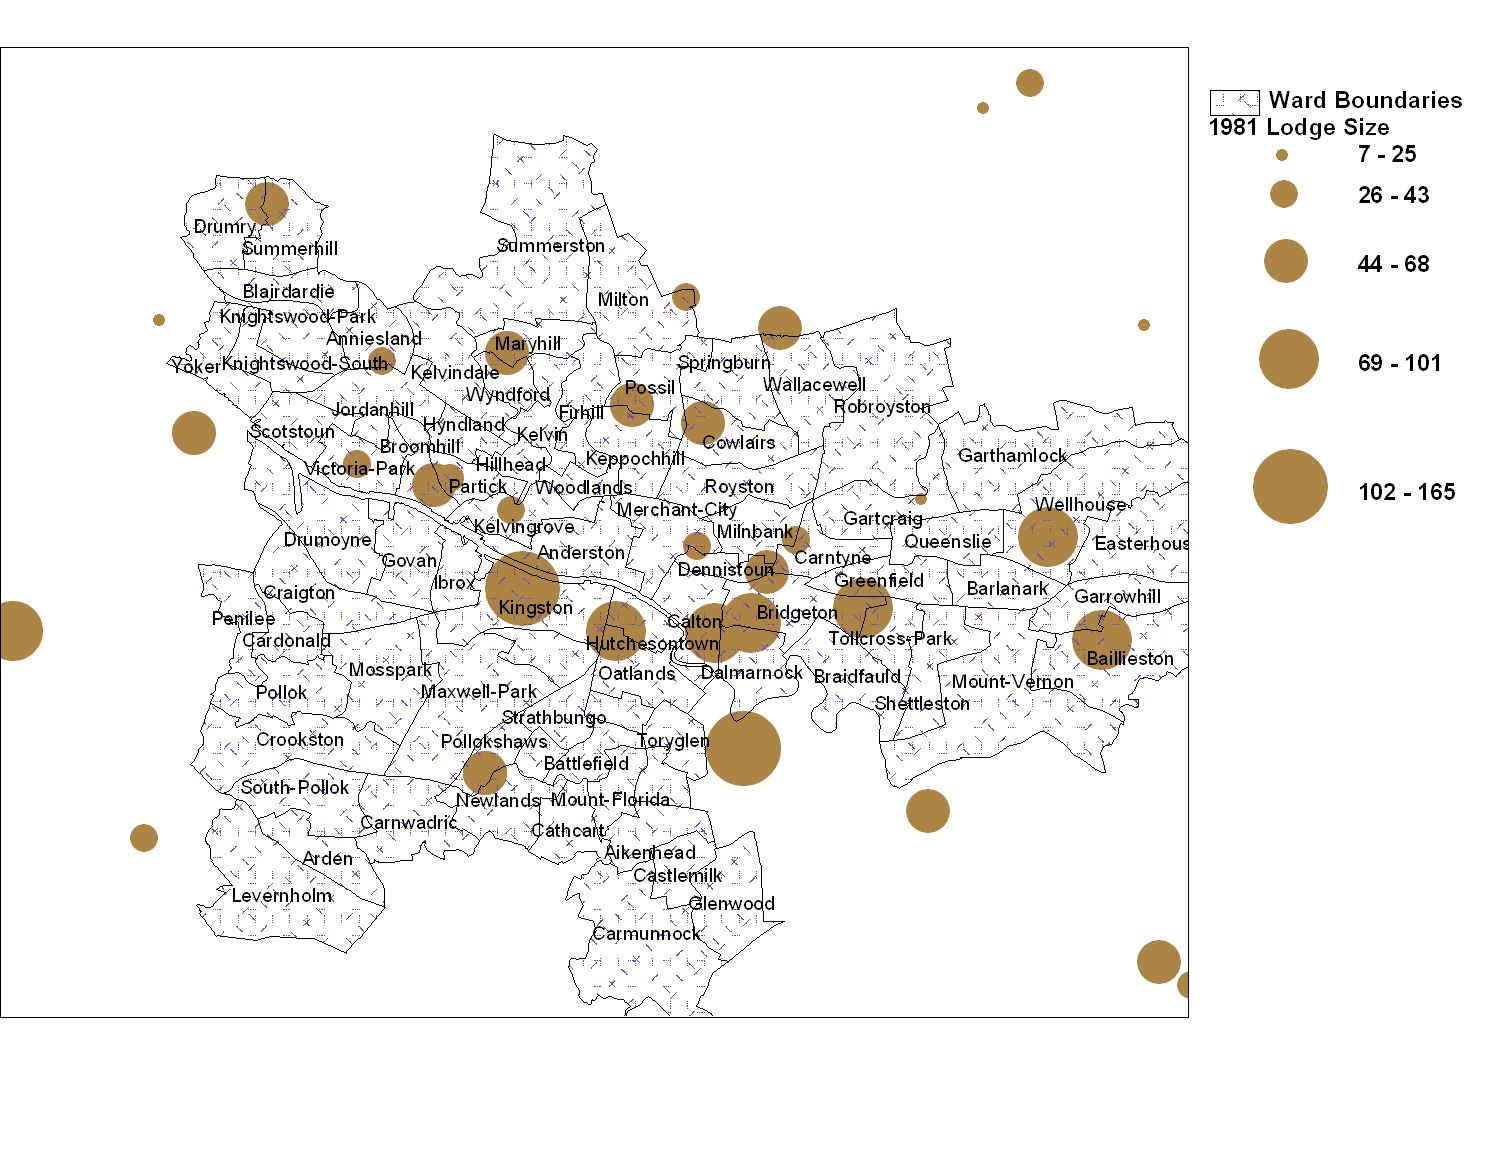
Fig. 7 Orange Lodges in Glasgow, 2001, inflated by size (click to enlarge, and hold cursor to zoom in)
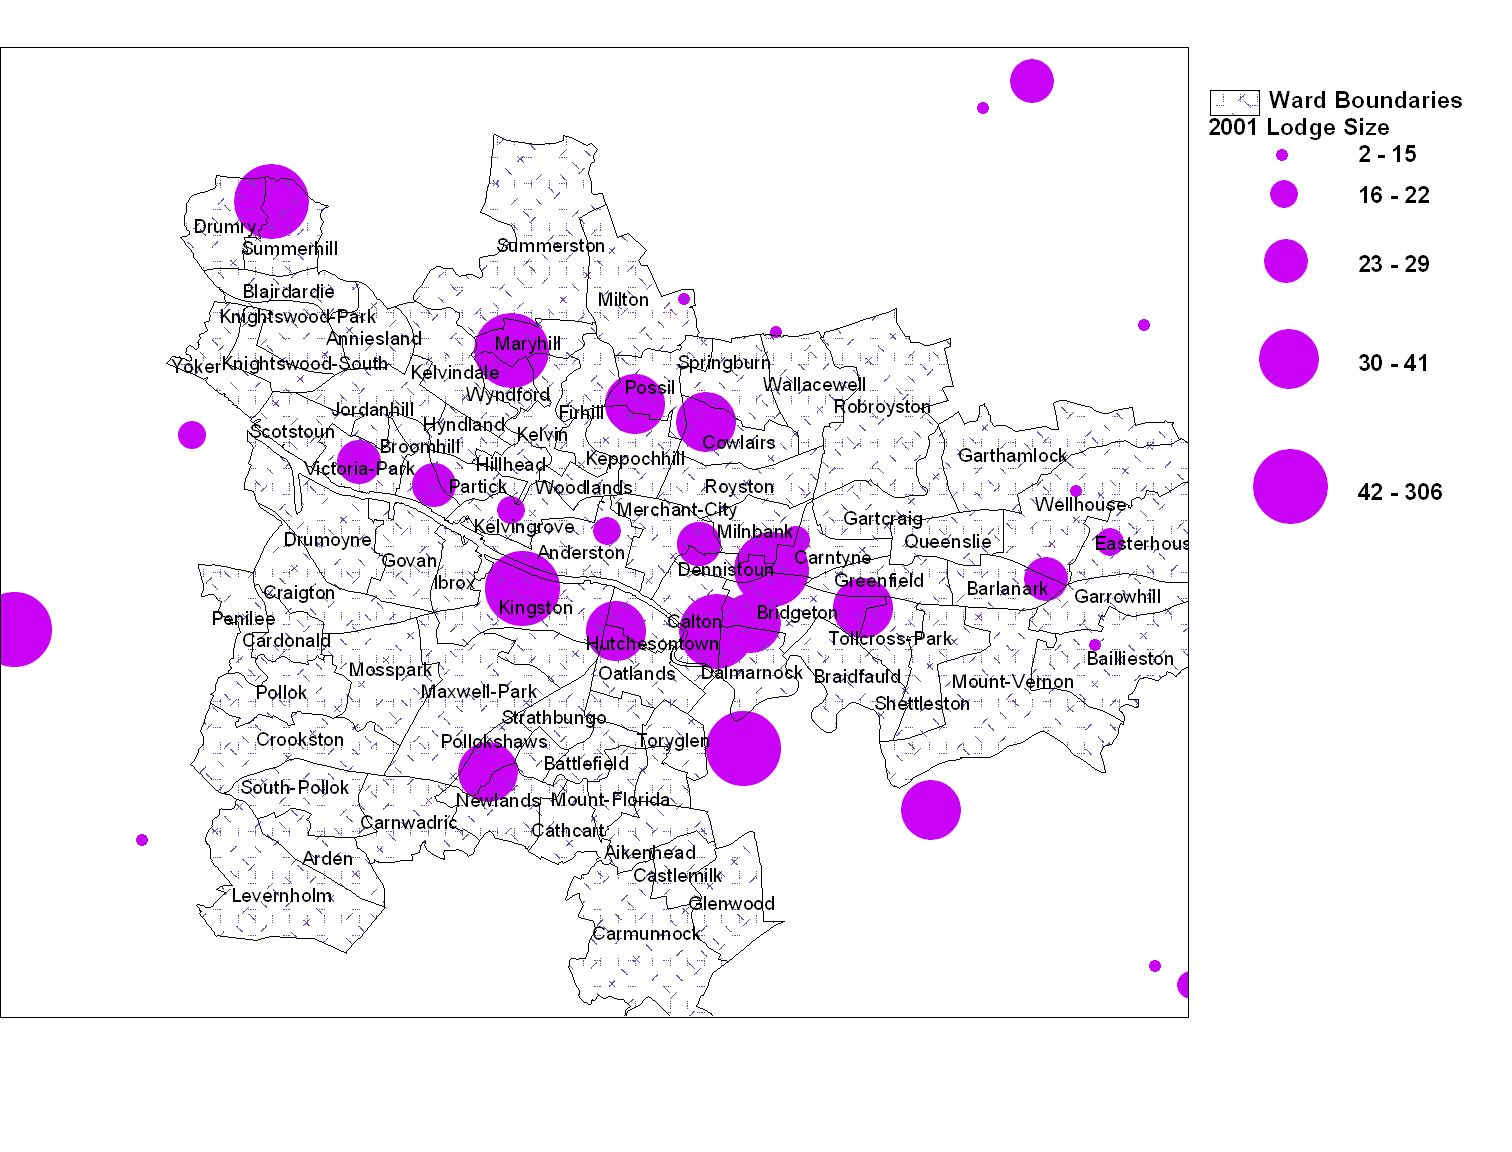
Fig. 8 Orange and Masonic Lodges, Scotland, 2001 (click to enlarge, and hold cursor to zoom in)
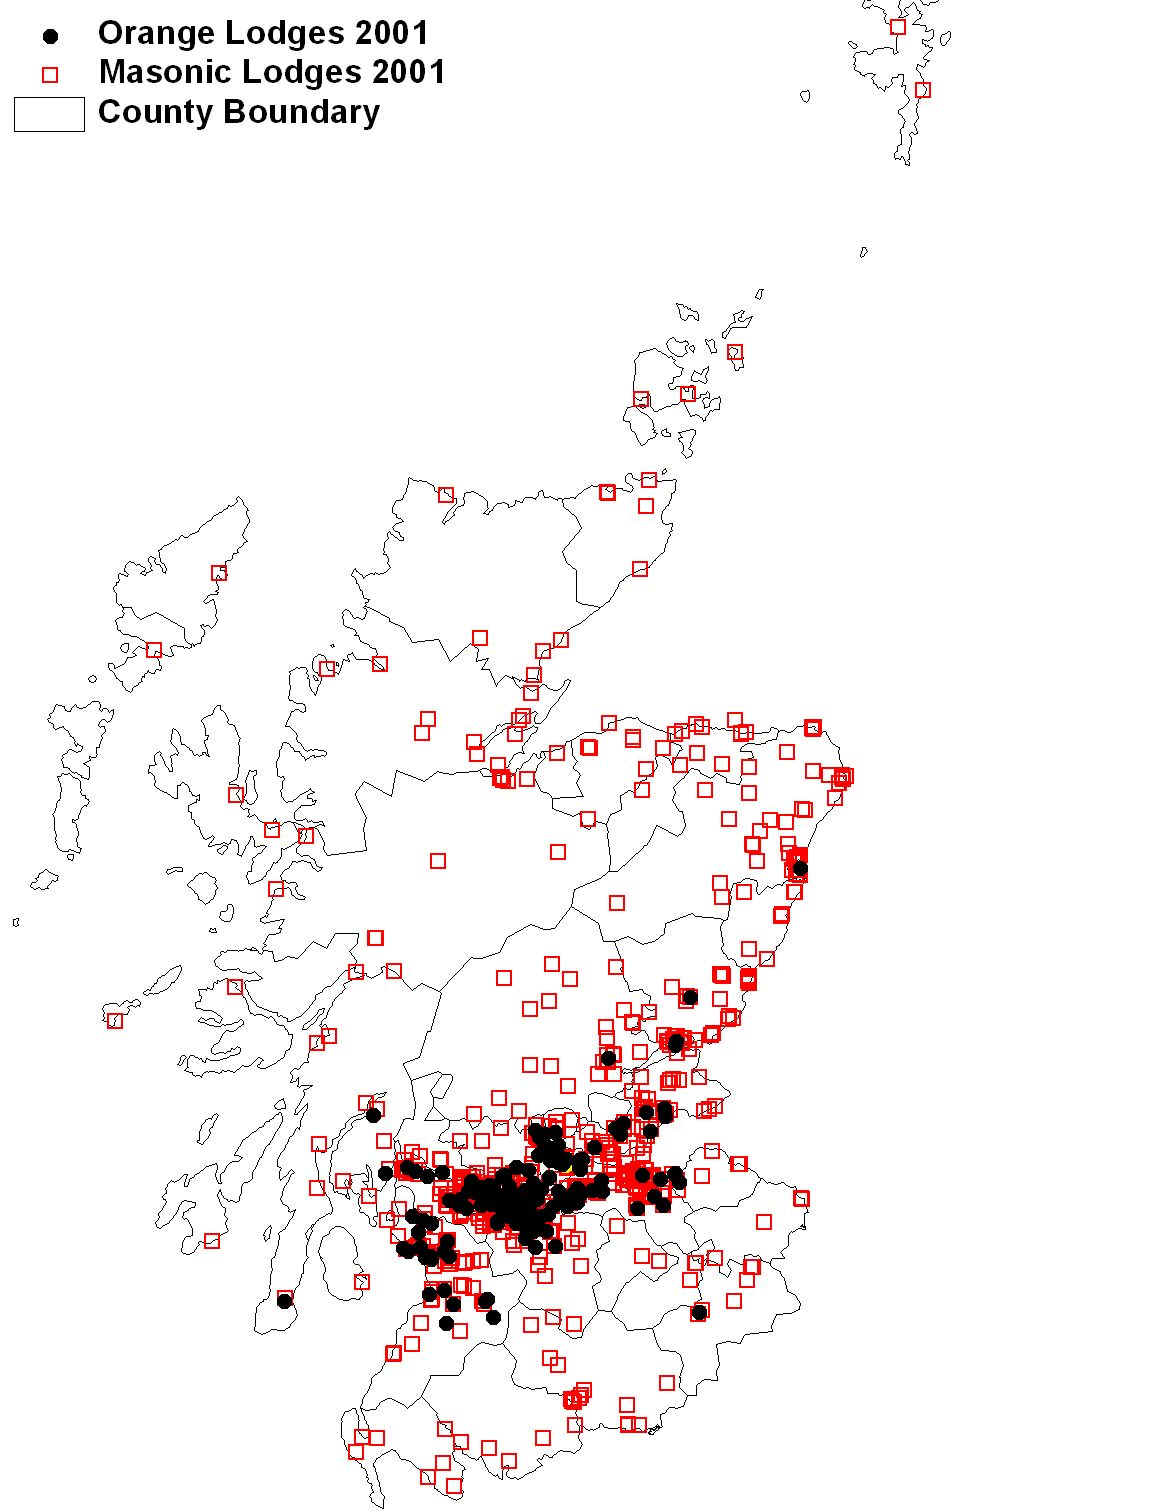
Fig. 9 Orange and Masonic Lodges in Glasgow, 2001 (click to enlarge, and hold cursor to zoom in)

Fig. 10
Fig. 11
Fig. 12
Fig. 13
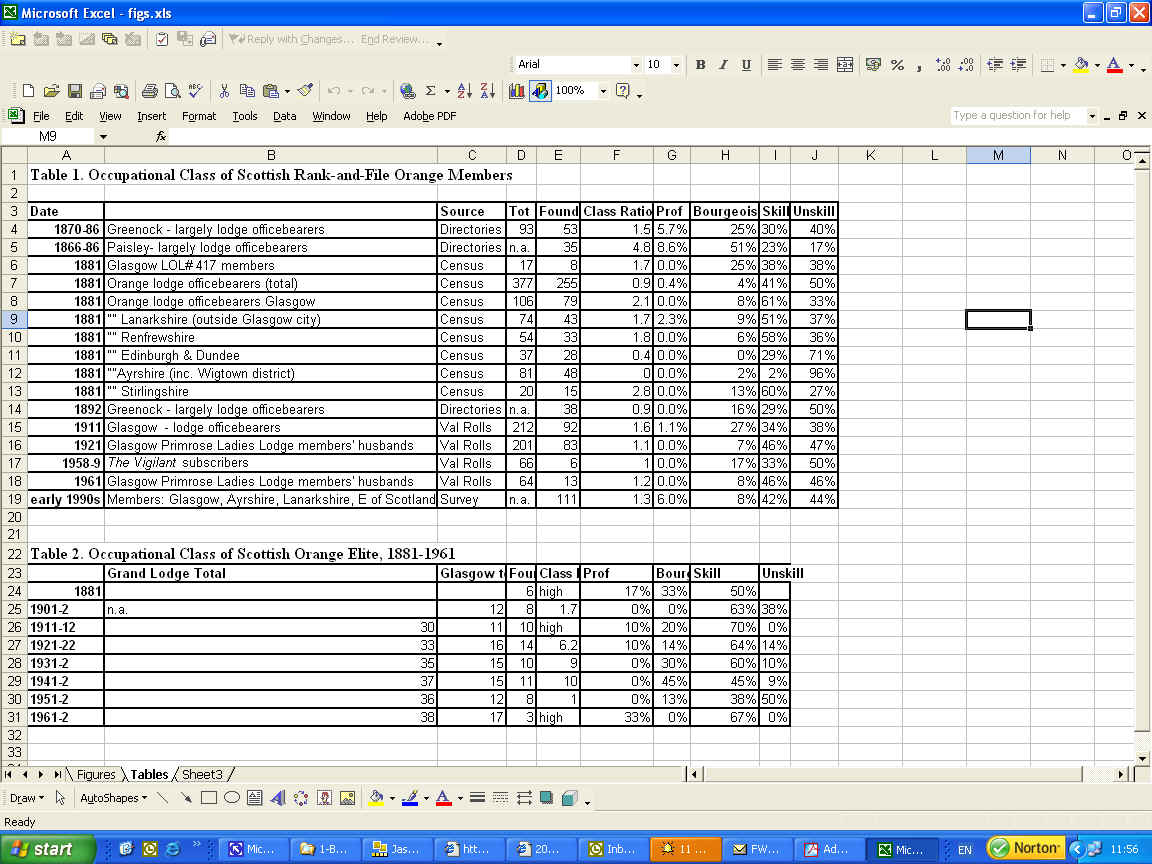
Tables 1 and 2